top of page

Module Initial
.png)
Une plateforme clé en main pour les équipes R&D, Innovation, Data, et Propriété Industrielle qui combine IA et théorie des graphes pour analyser stratégiquement l’information technique et scientifique.
Avec plus de 250 millions de publications scientifiques et plus de 90% des dépôts mondiaux, GraphMyTech modélise les liens complexes entre brevets, publications, acteurs et technologies.
Notre approche offre une lecture structurée et relationnelle des données, générant des insights fiables, actionnables et alignés sur les enjeux métier.
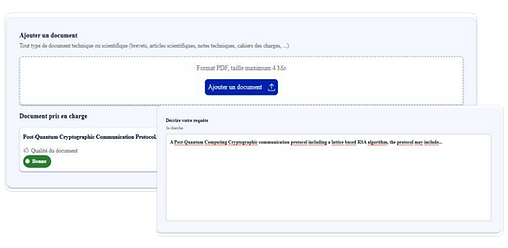
Recherchez comme vous pensez
📄Une interface intuitive en glisser-déposer et une recherche en langage naturel pilotée par l'IA.
💡Plus besoin de chercher tous les mots-clés ou de connaître le nom exact d’une technologie.
🔐Toutes les recherches sont sécurisées par chiffrement, garantissant la confidentialité de vos données sensibles.
.png)
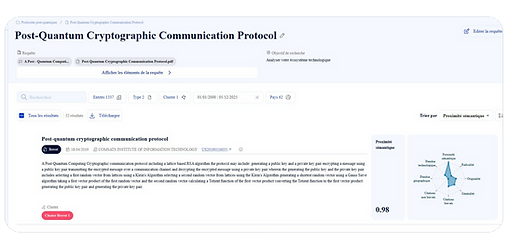
Toute l'innovation, sans limite
📊Chaque document est analysé selon plusieurs critères : sémantique, originalité, citations, portée technologique et géographique...
🔎Visualisez les liens entre technologies, repérez les signaux faibles, et positionnez chaque technologie dans son écosystème.
📁Filtrez par entités, clusters, dates, pays… ou utilisez la recherche intelligente pour accéder immédiatement à l'information utile.
.png)
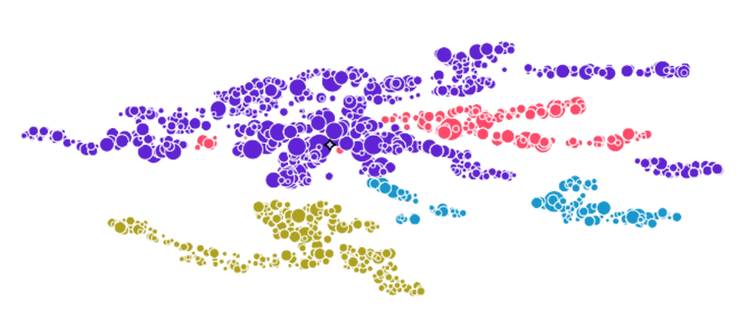
Explorez l’état de l’art
🔍Nos regroupements thématiques révèlent les synergies, les acteurs stratégiques et les technologies clés d’un domaine.
🧩Les graphes modélisent les relations complexes entre innovations, inventeurs et structures impliquées.
📈Visualisations multi-critères et clusters interactifs facilitent l’analyse stratégique et la compréhension fine des écosystèmes.
.png)
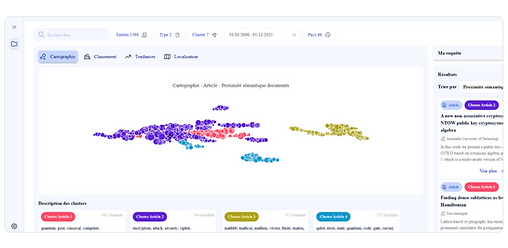
Cartographiez en un clic
📈Suivez les trajectoires d’évolution technologique pour détecter signaux faibles, tendances émergentes et dynamiques sectorielles.
🔎Analyse multi-niveaux : technologies, acteurs, territoires.
🧭Identifiez les opportunités d’implantation, de partenariat ou de diversification à l’échelle mondiale.
.png)
Nos résultats
Moins de collecte, plus d’analyse !
+68 % du temps est enfin dédié à l’analyse stratégique !
Contre seulement 25 % auparavant.

.png)
Un investissement plus stratégique !
Jusqu’à 40 % d’économies sur les budgets d’étude !
Réduisez le temps passé à la collecte.
Gagnez en volume et en réactivité !
Jusqu’à 3 fois plus d’études menées par an !
Grâce à nos modèles propriétaires.
.png)
bottom of page